Service managed by Daniel Vermeersch, a former quantitative fund developer and manager for several banking institutions.
Important notice: We offer stock selection reports for educational purposes only. They are ONLY available on this website. Any solicitation to sell Bullstockpicker reports elsewhere is identity theft, and the report offered would be counterfeit. Please report any suspected fraud using the contact form at the bottom of the page.
Notice importante: Nous proposons des rapports de sélection d’actions à titre pédagogique. Le seul et unique endroit où ils sont proposés est sur ce site. Toute sollicitation de vente de rapports bullstockpicker sur un autre endroit est une usurpation d’identité, et le rapport proposé serait un faux. Merci de signaler tout soupçon de fraude dans le formulaire de contact en bas de page.
Offre d’été: rapport hebdomadaire sur les actions du Cac 40 avec classement par scores momentum et gestion des risques. Disponible gratuitement jusqu’au 31 août. Pour l’obtenir, remplissez le formulaire de contact en bas de page, avec le mot “France” en message. Le 1er rapport vous sera envoyé au maximum 24h après votre demande.
Summer offer: weekly report on CAC 40 stocks with ranking by momentum scores and risk management. Available for free until August 31st. To get it, fill out the contact form at the bottom of the page, with the word ‘France’ in message. The first report will be sent to you within 24 hours at most after your request.
What we do:
We issue weekly reports to monitor the stock market’s heterogeneity and identify investment ideas. We do not provide trading or investing signals. We monitor a list of stocks that show a strong dynamic. It will help you build an outperforming stock portfolio, with a controlled risk level.
Our reports are educational in purpose and provide added value to your investment decisions. In addition, tutorials are available on our YouTube channel (subtitles in 15 major languages), and other social media, see links above.
Investment style:
Quantitative, dynamic, powered by price momentum, no subjectivity, no AI.
Investment universe:
-> The 200 largest American companies, monthly rebalancing to benefit from the survivorship bias.
-> The 100 largest members of the S&P400 Mid-Caps index, monthly rebalancing.
-> The 50 members of the Euro Stoxx 50.
Investment time horizon:
A few months to a few quarters.
Focused portfolio:
Our reports help investors build their own stock portfolio that we recommend being made of 15 to 20 stocks. That size eliminates a large portion of the unsystematic risk while giving you a chance to outperform the market with a decent level of risk.
Price Momentum:
The best past performers are likely to remain good performers. We monitor multi-timeframe scores (a slow and two fast scores) to build our momentum list. When the fast score is high enough with one of the slow scores also above that level, the stock’s dynamic is strong. Some of these high-scored stocks can show a parabolic move, which often ends badly. In addition, we might have a high concentration within a sector and face a severe decline when a sector rotation occurs. Therefore, robust risk control is required to succeed.
Risk Management:
Our reports help you monitor a set of data that control the risks. Risk monitoring also helps reduce the number of high-scored stocks to own. You can reach a portfolio size of 15 to 20 stocks by rejecting momentum stocks that increase your risk too much or are redundant to other stocks.
Beta: It’s a measure of the stock’s risk vs. the index. We recommend you monitor the average beta of your owned stocks and keep it in the range of 0.7 to 1.3, depending on the market’s dynamic. If your average beta is too low, your portfolio will be too inert, and you could be missing opportunities. On the other hand, a too-high average beta will carry too much risk, and you will face an important drawdown when the market moves against you.
Correlations: We monitor the coefficients of correlations of our high-scored stocks. Some of them show a weak correlation with other stocks and are interesting sources of diversification. Other stocks show high correlations and are likely to keep moving together, they are redundant. Keep control of the correlations between your owned stocks. Owning too many highly correlated stocks increases your risks. These stocks will move together and amplify your drawdown during a correction. When you consider a new stock to purchase, make sure that it is not too correlated with an already owned stock.
Reports:
Our reports help you build your focused portfolio, as they display the momentum scores. Highlighted high-scored stocks are good stocks to own as their price momentum is strong. In addition, the beta of each stock is mentioned so that you can easily monitor your average beta. A study of correlations between the high-scored stocks is also performed.
More information is available in our sample report.
Subscription:
To receive our reports for 13 weeks, visit the secured links below and proceed to the payment. Reports will be sent to your email during the next 13 weekends, before Monday’s market open.
-> US 200 big-caps reports: 13 weeks, USD 150
https://www.paypal.com/ncp/payment/P5QUZV5C3AC78
-> US 100 mid-caps reports: 13 weeks, USD 100
https://www.paypal.com/ncp/payment/WQ45CJ7SNACY8
-> European reports: 13 weeks, EUR 80
https://www.paypal.com/ncp/payment/VQ43K6M5ZCFLS
US Big-Caps Performance monitoring:
The chart below compares the 52-week performance of the equally weighted high-scored stocks (about 45 stocks) with the 200 equally weighted monitored stocks, and the S&P 500 tracker (big caps report).
Last 52 week returns (18JUL25-17JUL26):
SPY: +18.4%; 200 stocks equally weighted:+30.0%; High-scored stocks: +56.7%
Current average beta of high-scored stocks: 1.54

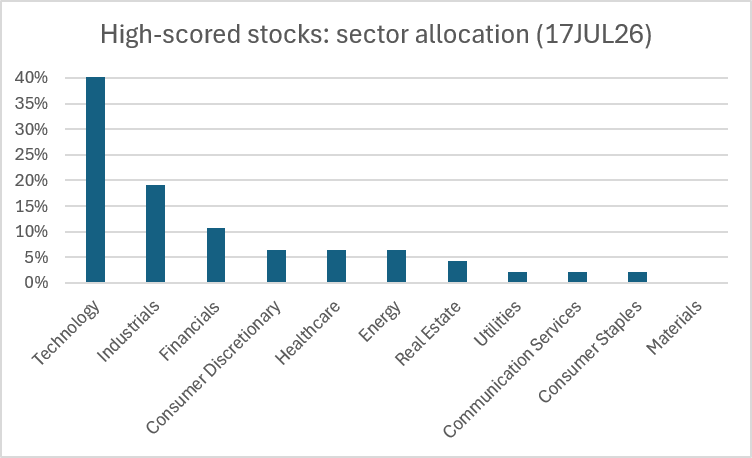
US Sector allocation:
The bar chart below shows the sector allocation of our high-scored stocks. It is updated weekly. Last closing prices: FRI 17JUL26. Our subscribers receive data for individual stocks.
US Big-Caps Sample Report:
US Mid-Caps Sample Report:
European Sample Report:
Contact:

